A few days ago I stumbled upon A public data lake for analysis of COVID-19 data.
Setting the stage - What is a Data Lake?
The key properties of a Data lake (Wikipedia):
- Holds various types of data in its natural or raw format,
- is usually envisioned as the single store of all enterprise data and
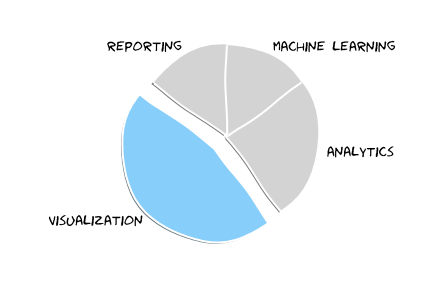
- used for reporting, visualization, analytics, and machine learning.
We'll take semi-structured data
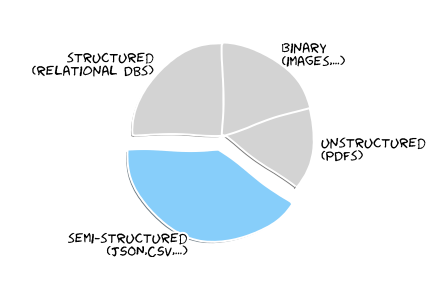
and visualize raw plus aggregated data
I decided it's about time to remove the dust from my XKCD JupiterLab and tap into new territory: fishing and process semi-structured data.
Prepare the Docker-based JupiterLab environment (optional)
You might argue that it's possible to grab the data directly via HTTPS, but we decided to use the S3 API with Boto3 to access the data (and learn something new today).
Boto3 - The AWS SDK for Python
To install the Python library into our JupiterHub container we need to update the Dockerfile
RUN pip install boto3
And link the .aws/credentials into the container like follows:
services:
  xkcd-jupiterhub:
    volumes:
     - .aws/credentials:/home/jovyan/.aws/credentials
Read from an S3 Bucket
Get an object from an S3 bucket with boto3:
client = boto3.client('s3')

key = 'enigma-jhu-timeseries/csv/jhu_csse_covid_19_timeseries_merged.csv'
covid_19_timeseries = client.get_object(Bucket='covid19-lake', Key=key)
Read the Body of the semi-structured CSV into a Panda DataFrame with pandas.read_csv
df = pd.read_csv(covid_19_timeseries['Body'])
Filter and aggregate the raw data
Grab the country_region you are interested in and set a new index and reduce the data to the columns we are interested in:
germany_only = df[(df.country_region == "Germany")]
germany_only.set_index(['date','country_region'])[['confirmed','deaths','recovered']]
And calculate the actual cases via simple math
confirmed = germany_only.confirmed
recovered = germany_only.recovered
deaths = germany_only.deaths

actual = germany_only.confirmed - germany_only.recovered - germany_only.deaths
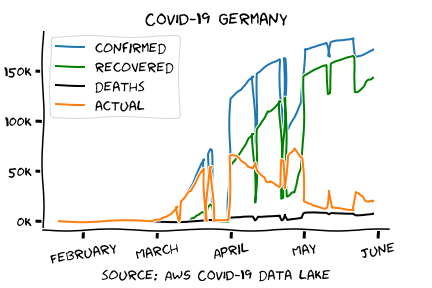
Visualize the results
With the data already prepared it's basically:
plt.plot(date, confirmed, label = 'confirmed')
plt.plot(date, recovered, label = 'recovered', color = 'green')
plt.plot(date, deaths, label = 'deaths', color = 'black')
plt.plot(date, actual, label = 'actual')
Feel free to grab the XKCD JupiterLab in case you want to work with the data of your region.
Wrap-Up
As simple as this example may be it reveals some of the challenges of a Data lake (data quality):
- keep your data lake up-to-date (At the time of writing, the CSV data contains no data for the last two weeks.)
- handle data quality (Parts of the historic data seem to be missing)
Thanks for reading and take care...
Photo by Mukesh Mishra