This post explains how to set up basic monitoring with Prometheus of the Docker environment running on your developer machine.
Pometheus - From metrics to insight
In this walk-through we essentially follow the instructions from docker docs - Collect Docker metrics with Prometheus while developing a reusable Docker Compose setup.
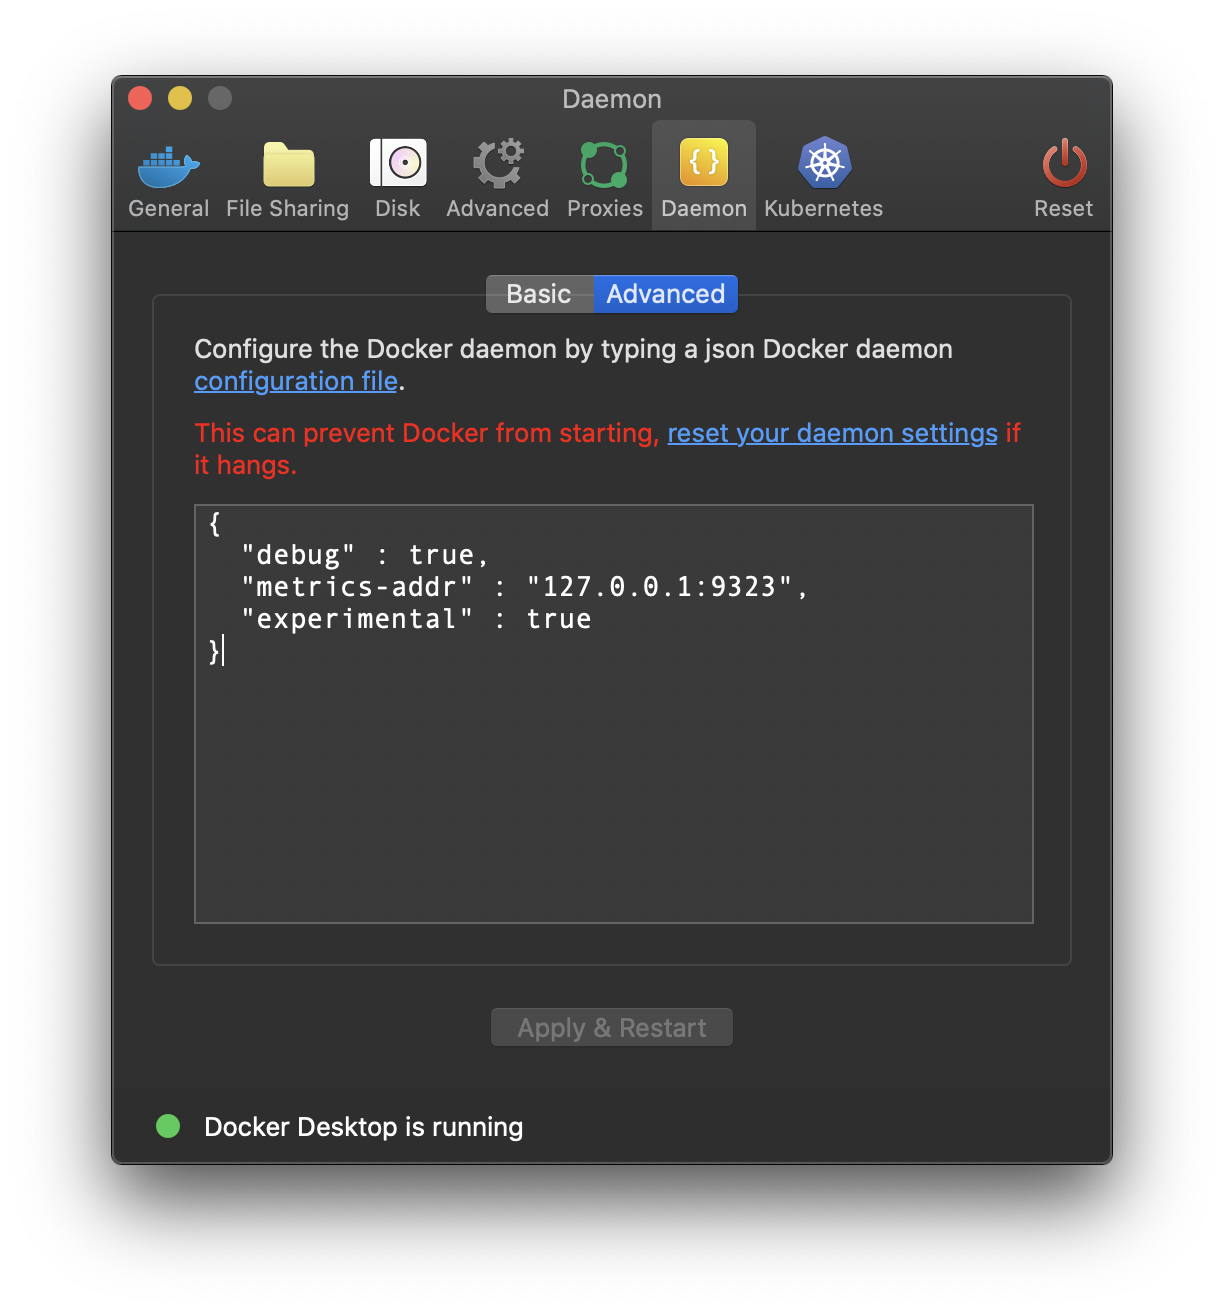
Find the location of your Docker system’s daemon.json.
If unsure check the section Configure Docker in Collect Docker metrics with Prometheus.
{
  "metrics-addr" : "127.0.0.1:9323",
  "experimental" : true
}
Note: Such a configuration change requires a restart of the Docker daemon.
Whether the Docker metrics are available or not can be verified with a simple get request (e.g. via browser) to the URL http://localhost:9323/metrics
Prepare a small docker-compose.yaml for the Prometheus service.
version: "3.7"

services:
  prometheus:
    image: prom/prometheus:v2.15.2
    volumes:
      - ./prometheus/prometheus.yml:/etc/prometheus/prometheus.yml
    command:
      - '--config.file=/etc/prometheus/prometheus.yml'
    ports:
      - 9090:9090
Hint: You might want to check for the latest available version on DockerHub prom/prometheus.
Put the minimal configuration file prometheus.yml into a subfolder named prometheus.
global:
  scrape_interval: 15s
  scrape_timeout: 10s
  evaluation_interval: 15s
  external_labels:
    monitor: codelab-monitor
scrape_configs:
- job_name: docker
  honor_timestamps: true
  scrape_interval: 15s
  scrape_timeout: 10s
  metrics_path: /metrics
  scheme: http
  static_configs:
  - targets:
    - docker.for.mac.host.internal:9323
Fire up the Prometheus container and check the results/targets http://localhost:9090/targets/
Congratulations you’ve successfully set up a monitoring for your local Docker environment! 👏